SECTOR ANALYSIS
Insider's Sector Stories
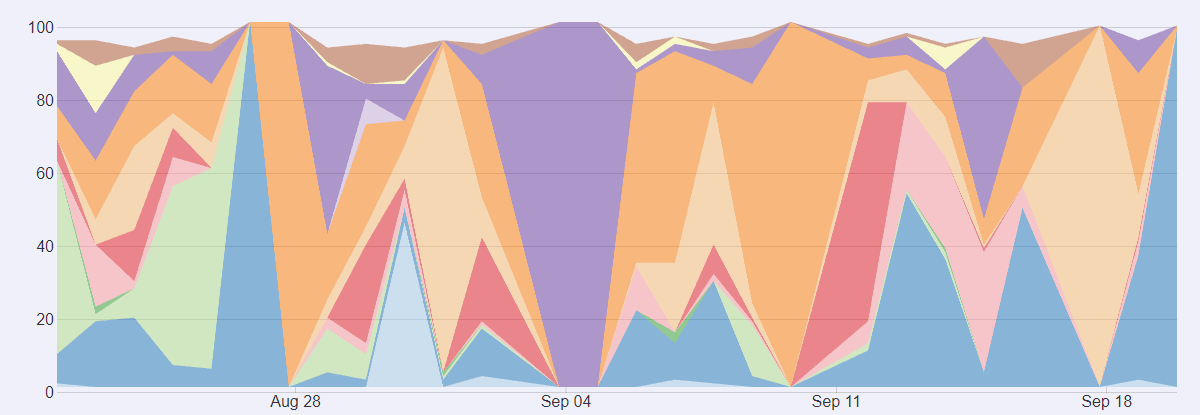
Why is there a picture of abstract art above? The picture above shows insider trading volume by sector for the past month. If you see any patterns please send us an email because we're drawing a blank.
Why does sectorwise insider trading look like that? We have a couple theories. First, the volume of insider trades on any given day is not sufficient to smooth out sectors. On any given day one person might trade a hundred million and now their sector's slice is everything.
Another factor is the relative size of sectors. Some sectors just have much bigger companies in them so their relative percentage is much greater leading to the appearance of tiny slivers and great triangles
How can you use sectors to inform insider trading analysis? Its clear that a month is not long enough for sector's to paint us a clear picture. When looking for sectors make sure to analysis atleast half a year of data, and focus in on either just buys or sells not total volume so you can understand the direction that sector is going.